Recording and collection of measured data
The method of recording data that have been measured by means of the measurement recording unit becomes as follows.
Recording of measured data
When recording measured data, either of the following 2 methods, A and B, is available.
- A.Record measured data by using the internal memory of the measurement recording unit.
- B.Record measured data, without using the internal memory of the measurement recording unit, on a field book, etc. by looking at the indication on the liquid crystal display.
A.When the data are recorded in the internal memory of the device main body (for users who need the peak value (PD))
Users who need the 60 peak values (PDs) that will become the ground for calculation of the typical value (D) should record the data by using this method.
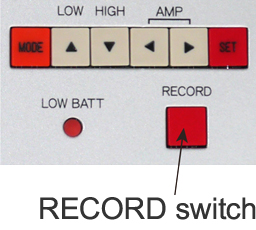
[1] Press the RECORD switch at the time when measurement should be started.
[2] Upon pressing the RECORD switch, the peak value (PD) and typical value (D) indicated on the screen become 0 first, and one second thereafter data collection is started.
[3] During the measurement, the PD indication on the screen shows the peak value (PD) now being measured.
(During the measurement, the indication of D remains to be 0.)
[4] When measurement has finished and the setting for record confirmation is turned ON
 the above indication appears; press SET if the data should be recorded, and press MODE if the data is not to be recorded.
(On the settings, if record confirmation is set to OFF, a recording is done automatically, and the system advances to [5].)
[5] Upon completion of the recording, the typical value (D) appears which is the result of calculation processing, and the mark "*" is indicated just before "D" and at the same time 1 is added to the number of records.
If NO (=MODE) is pressed by record confirmation, it is not added to the number of records.

The data to be recorded are shown in Table 1.
| Data name | Contents |
|---|---|
| Record number | It is the number for controlling the number of records. Each time when a recording is done, the number is increased by 1. (As this number is smaller, it means that the data is older.) |
| Date and time | They are the date and time when measurement was made. The year, month, day, hour, minute and second are recorded. |
| Peak value (PD) | It is the peak value (PD) that has been calculated by primary processing at each time of measurement. 60 peak values (PDs) are recorded. |
| Typical value (D) | It is the typical value calculated by the peak value (D) at each time of measurement. The value is calculated by secondary processing. |
| Setting value |
Each of the setting values that have been set when making measurement is recorded.
|
* The recording capacity of this device for measured data is up to a maximum of 800 records. When the record number reaches 800, no recording is made even when the RECORD switch is pressed.
* While data are collected, power should not be turned off. If power is turned off, the recorded data may be erased.
* The recorded data can be output to a PC, etc. as serial signals.
B. When the data are recorded in a field book by looking at the indication on the liquid crystal display (for users who do not need the peak value (PD))
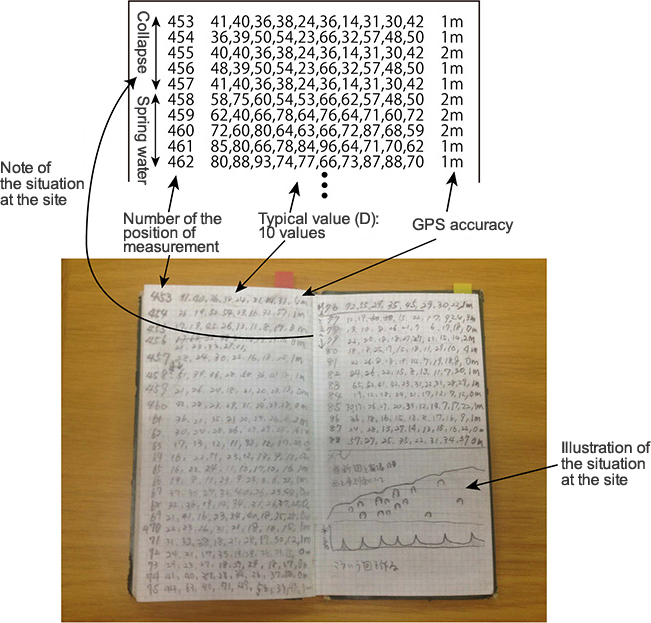
Users who need the typical value (D) only and do not need the 60 peak values (PDs) that will become the ground for calculation of the typical value (D) may use a method of writing down the typical value (D) only onto the field book continuously (Fig. 1).

After installing the pickup sensor and making settings for the filter, rate of amplification, etc., the typical value (D) indicated on the right below the liquid crystal display screen changes as time elapses. Make a note of about 10 consecutive typical values (D) on the field book (the value should not be recorded if there is any noise in the value). The 10 typical values (D) that have thus been recorded on the field book are averaged later, and the average is used as the typical value (D) in that place.
Data collection
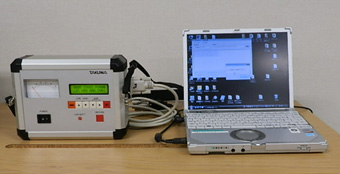
This device enables the recorded data to be collected into a PC using serial signals by connecting a PC to the device.
Note that with the PC, the recorded data are stored by using the "Groundwater Aeration Sound Data Import Software" for Windows that is attached to this device.
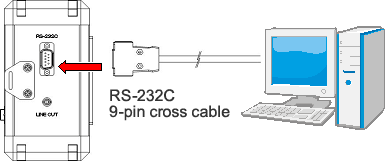
■Connection with a PC
By using an RS-232C 9-pin cross cable to be prepared separately, connect the RS-232C output connector on the side of this device with the RS-232C connector of the PC, and collect the data stored in the internal memory (Fig. 2).
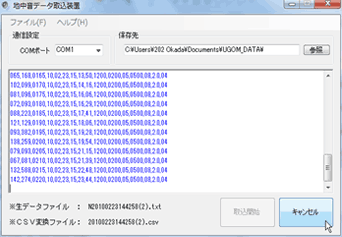
The "Groundwater Aeration Sound Data Import Software" outputs the following 2 types of files for analysis from the received data.
- The measurement date & time data and the typical value (D) data are stored in a file of the CSV format.
- The 60 peak value (PD) data that will become the basis for obtaining the typical value (D) are stored as text data.
- If the PC has no RS-232C connector, a USB serial conversion adaptor should be used.
* For details, refer to the instruction manual for the Groundwater Aeration Sound Data Import Software "GAS DATA IMPORT."